Self-hosted cluster monitoring
Every box you own, one pane of glass.
Linux, macOS and Windows hosts reporting to a dashboard you run. See pooled capacity across the whole cluster, then drill into any host. No inbound firewall rules, no SaaS, no per-host pricing.

Your whole fleet as one machine: pooled cores, RAM and disk in a single line.
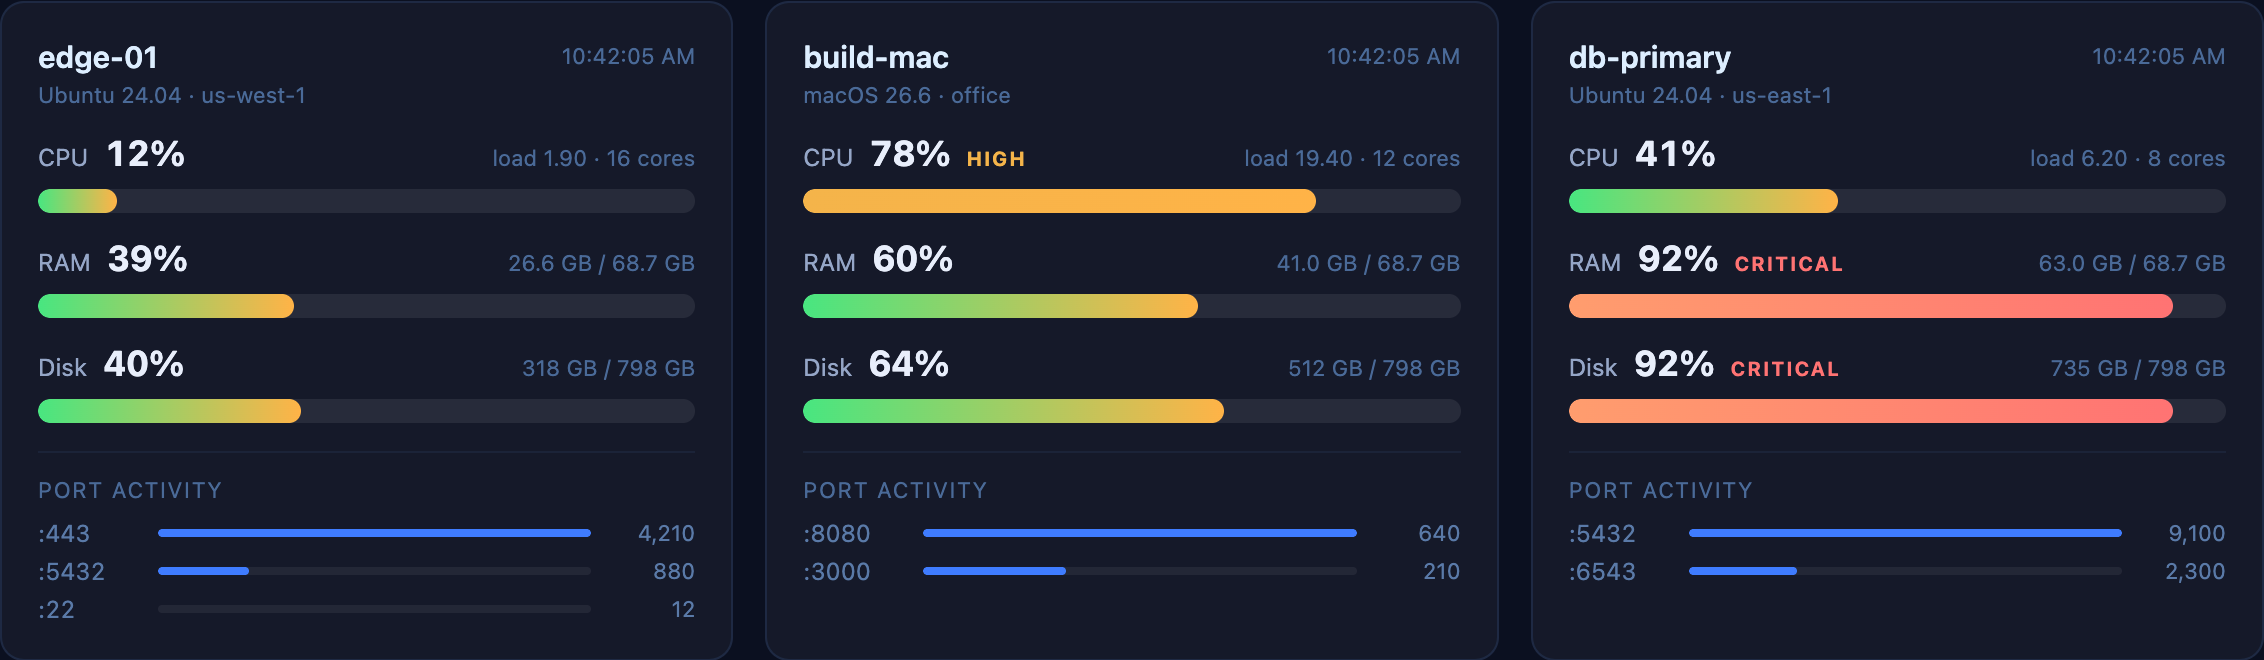
Then per host, with thresholds flagging trouble before you go looking for it.
What you get
Cluster totals
Pooled CPU, RAM and disk across every host — and CPU is core-weighted, so a busy 32-core box isn’t diluted by an idle 2-core one.
Push, not pull
Hosts behind NAT or on Tailscale report in. No collector reachability to arrange.
Load average, not just %
Utilisation pins at 100% and goes quiet. Load keeps climbing — per host, per core.
Port activity
Per-port connection counts with history, so you can see which service is busy.
Your data, your box
SQLite on hardware you control. Plain JSON API to script against.
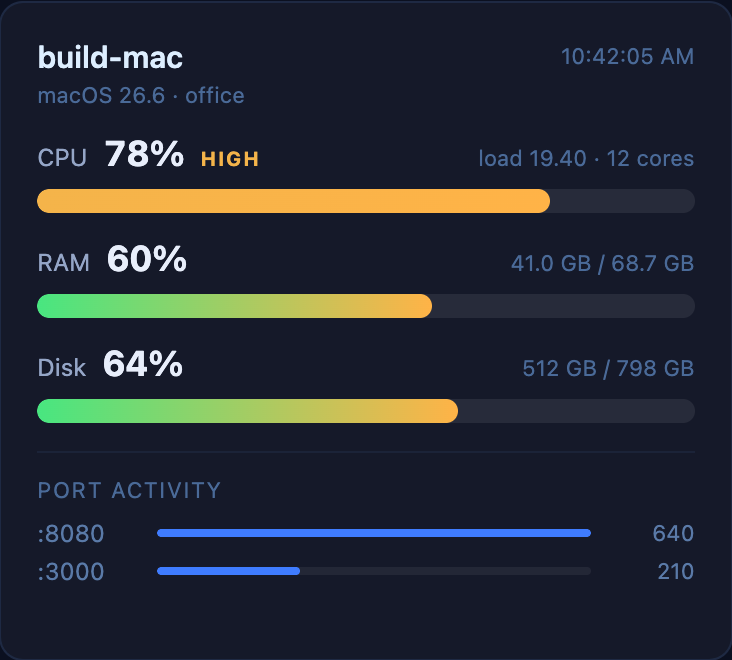
Per-host detail: meters, thresholds, load and the ports taking traffic.
Getting started
1. Run the agent → 2. Paste the ingest token → 3. The host appears
Add your first server
Download the Mothership agent for the computer you want to monitor, then connect it with your server's ingest token.
All downloadsClient agents are free to download. A Mothership license is required to connect servers to this dashboard.
Purchase Mothership Server
Unlock dashboard access and the Mothership Server installer with a one-time purchase. Client agents are free to download.
1. Sign in ✓ → 2. Purchase → 3. Download
Dashboard
Send one verified Docker release to every registered Mothership agent. Each host pulls over HTTPS, verifies the SHA-256 checksum, then activates its locally configured container deployment hook.
Create a profile to get an ingest token for a new host, then add it to
that host's agent.conf as MOTHERSHIP_INGEST_URL. Point the URL at
this Mothership Server's own tailnet or LAN address on port 8097 when possible. Remote clients
without that route can use this public HTTPS hostname at /api/ingest/<token>;
only that bearer-token ingest path is exposed, while dashboard reads remain signed-in and
entitlement-gated. (The preferred tailnet address is visible on this Mac's own card above.)
Coming next
Widgets
Dashboard widgets
API
Mothership API access